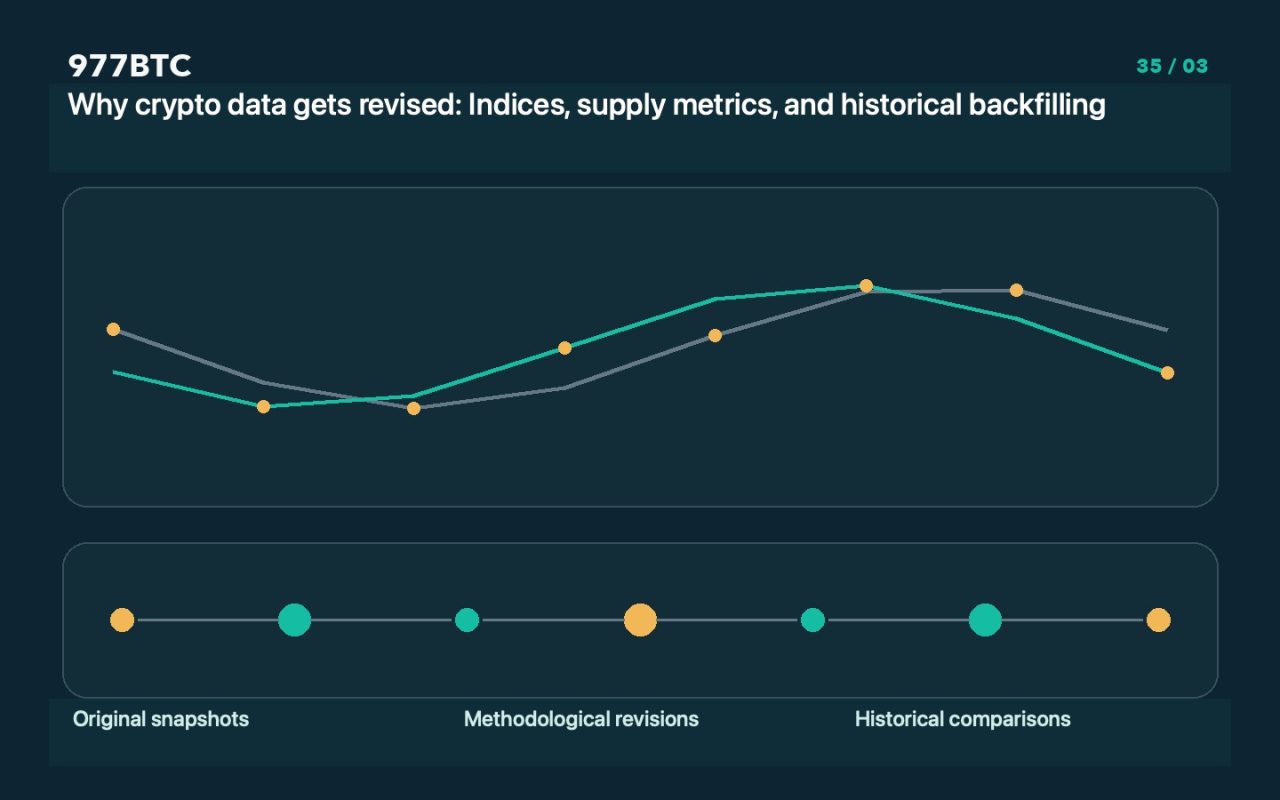
Historical data is not necessarily immutable.
Market data providers may adjust historical records to incorporate additional sources, correct anomalies, or update methodologies. A revision does not automatically imply fabrication, nor should it be dismissed as a routine occurrence that requires no explanation. When consuming news, distinguish between real-time observations, delayed data, and subsequent revisions; note the time of your query and the data version—two charts for the same day may not have been generated from the same dataset.
Always check the definition of the metric first.
Metrics such as price, trading volume, market capitalization, circulating supply, and total value locked (TVL) are calculated using different methodologies. Supply figures may be derived from project disclosures or on-chain analysis, while trading volume might be filtered or weighted. Review the provider’s definitions—including the markets covered, how anomalies are handled, and update frequencies—and avoid simply dividing one metric by another just because they share similar names. If a news report does not specify the calculation methodology, consult the provider’s documentation and acknowledge any remaining ambiguities.
Handle outliers and missing values separately.
Extreme price quotes may stem from fleeting liquidity, erroneous trading pairs, or data errors, while missing values might be backfilled later. Do not arbitrarily delete all outliers and claim to have uncovered the "true" trend; likewise, do not treat missing data points as zero. Charts should specify the rules applied to the data—particularly any changes in methodology over long time horizons—to prevent readers from misinterpreting statistical revisions as sudden, genuine shifts in the market.
Identifying revisions through snapshots
Save two exported versions of the same metric, asset, time frame, and unit. Compare them to identify which data points have changed, then consult the provider’s revision notes. Maintain a table of discrepancies that includes the original value, the new value, the time of the initial observation, and the potential reason for the change. Do not automatically assume that an older report is incorrect simply because a newer version exists; assessing the accuracy of an older piece requires examining the information available at that time, as well as whether the sources and time references were clearly documented.
Comparing data across different sources: simple averaging is not always appropriate
Different data providers may share the same upstream sources or, conversely, apply different filters to the market; therefore, the average of two figures is not inherently more reliable. When drawing significant conclusions, it is more meaningful to explain methodological differences than to cherry-pick the most favorable figures. Furthermore, price charts and indices are distinct from the actual execution data within a platform account; the costs a trader might realistically incur cannot be substantiated solely by aggregated quotes.
How to issue corrections for published reports
If a data revision affects your conclusions, document the date of the revision, the source, the specific sections impacted, and the original methodology used; keep a record of all such corrections. Do not obscure discrepancies simply because the original headline has already circulated, and ensure that methodological updates are not mischaracterized as new capital inflows. This text serves as a guide for interpreting data and does not provide real-time pricing or investment advice; no market indicator can, on its own, guarantee future performance.